
UNITED STATES
SECURITIES AND EXCHANGE COMMISSION
WASHINGTON, D.C. 20549
FORM 8-K
CURRENT REPORT
Pursuant to Section 13 OR 15(d) of the
Securities Exchange Act of 1934
Date of report (Date of earliest event reported): August 6, 2026
| (Exact name of registrant as specified in its charter) | ||||||||
| (State or other jurisdiction of incorporation) | (Commission File Number) | (IRS Employer Identification No.) | ||||||
| (Address of principal executive offices) | (Zip Code) | |||||||
Registrant’s telephone number, including area code: (646 ) 832-1000
(Former name or former address, if changed since last report)
Check the appropriate box below if the Form 8-K filing is intended to simultaneously satisfy the filing obligation of the registrant under any of the following provisions:
| Securities registered pursuant to Section 12(b) of the Act: | ||||||||
| Title of each class | Trading Symbol(s) | Name of each exchange on which registered | ||||||
Indicate by check mark whether the registrant is an emerging growth company as defined in Rule 405 of the Securities Act of 1933 (§230.405 of this chapter) or Rule 12b-2 of the Securities Exchange Act of 1934 (§240.12b-2 of this chapter).
Emerging growth company ☐
If an emerging growth company, indicate by check mark if the registrant has elected not to use the extended transition period for complying with any new or revised financial accounting standards provided pursuant to Section 13(a) of the Exchange Act. ☐
Item 2.02. Results of Operations and Financial Condition
On August 6, 2026, Versant Media Group, Inc (“Versant”) issued a press release reporting its financial results and the results of its operations for the quarter ended June 30, 2026. A copy of the press release is furnished as Exhibit 99.1 to this Current Report on Form 8-K and is incorporated herein by reference.
Item 7.01. Regulation FD Disclosure.
In addition, Versant also posted certain supplemental financial information on its website. A copy of this supplemental financial information is furnished as Exhibit 99.2 to this Current Report on Form 8-K and is incorporated herein by reference.
The information being furnished pursuant to Item 2.02, including Exhibit 99.1, and Item 7.01, including Exhibit 99.2, of this Current Report on Form 8-K shall not be deemed to be “filed” for purposes of Section 18 of the Securities Exchange Act of 1934, as amended (the “Exchange Act”), or otherwise be subject to the liability of that section, and shall not be incorporated by reference into any other document filed under the Securities Act of 1933, as amended, or the Exchange Act, except as shall be expressly set forth by specific reference in such filing.
Item 9.01. Financial Statements and Exhibits
Exhibit Number | Description | ||||
| 104 | Cover Page Interactive Data File (embedded within the Inline XBRL document) | ||||
SIGNATURES
Pursuant to the requirements of the Securities Exchange Act of 1934, the registrant has duly caused this report to be signed on its behalf by the undersigned hereunto duly authorized.
VERSANT MEDIA GROUP, INC | |||||||||||
| Date: | August 6, 2026 | By: | /s/ Anand M. Kini | ||||||||
Name: | Anand M. Kini | ||||||||||
Title: | Chief Financial Officer and Chief Operating Officer | ||||||||||
 | ||||||||||||||||||||||||||
Versant Media Reports Second Quarter 2026 Operating and Financial Results
•Revenue of $1.64 Billion
•Net Income Attributable to Versant of $211 Million
•Adjusted EBITDA of $624 Million1
•Declared Third Quarterly Cash Dividend of $0.375 Per Share
•Completed $100 Million Accelerated Share Repurchase Transaction
•Announced an Additional Planned $100 Million ASR in the Third Quarter of 2026
NEW YORK, NY – August 6, 2026. Versant Media Group, Inc. (Nasdaq: VSNT) (the “Company”) today reported operating and financial results for the second quarter of 2026. The Company's results reflect continued operating momentum, the strong performance of Versant's leading brands and long-term growth initiatives.
"Versant's brands once again demonstrated strength, durability and scale, reaching more than 120 million viewers each month during the quarter while reinforcing our leadership across news, sports and entertainment," said Mark Lazarus, Chief Executive Officer. "That performance was reflected in the recent multi-year renewals with two large distribution partners, one in the U.S. and one in Canada. At the same time, we continued executing our strategy by investing in opportunities that will drive the next phase of our growth. Following the second quarter, we completed the Full Swing acquisition, added the Bundesliga to our premium sports portfolio, expanded Fandango into a broader consumer entertainment platform, and advanced our direct-to-consumer initiatives at CNBC and MS NOW. Together, we believe these initiatives build on the foundation of our portfolio, deepen consumer engagement, and position Versant for long-term growth."
"I'm proud of our performance in the second quarter and the disciplined execution across the business," said Anand Kini, Chief Financial Officer and Chief Operating Officer. "Our results highlight the strength of our operating model, continued growth across Platforms and meaningful cash flow generation. We continue to invest in our strategic priorities with a balanced approach to capital allocation. In the second quarter, we repurchased $100 million of stock, and today we announced that we expect to enter into an additional $100 million accelerated share repurchase agreement and declared our third quarterly cash dividend of $0.375 per share, reflecting our confidence in the business and financial outlook."
1 Adjusted EBITDA is a non-GAAP financial measure. Further information and reconciliation to the most comparable GAAP measure can be found under Table 4 below.
Business Highlights: In the second quarter of 2026, Versant continued to invest in its brands, deepen consumer engagement and extend its businesses beyond pay TV.
Business News and Personal Finance: In the second quarter, CNBC reinforced its position as the leading global business news brand. The network ranked among the top 10 cable networks for the fourth consecutive month during market hours in June and remains the trusted destination for consequential market events. Coverage of the SpaceX IPO drove CNBC's highest-rated day in more than five years. CNBC also generated the most affluent and educated weekday daytime audience in television for the 27th consecutive quarter. The network featured exclusive interviews with leading business executives and policymakers, including Jeff Bezos, whose appearance generated more than 100 million video views across platforms.
Political News and Opinion: MS NOW delivered its seventh consecutive month of year-over-year audience growth in June and finished the month as the second-highest-rated television network across all genres. In June, viewers watched an average of nine hours each week, the second-highest level of engagement across all television, while viewership increased 14% in the second quarter versus the prior year. The network also generated nearly 3 billion combined YouTube and TikTok views year to date and, in June, ranked as the No. 1 news organization on YouTube. Podcast engagement remained strong, with more than 11 million audio downloads during the month. In July, MS NOW celebrated its 30th anniversary, marking an important milestone for the network.
Golf: PGA TOUR coverage delivered the most-watched second quarter since 2020. Throughout the quarter, the network delivered comprehensive coverage of the Masters, PGA Championship, U.S. Open and PGA TOUR signature events, reflecting strong demand for premium live golf and the strength of the Golf Channel brand.
Sports and Genre Entertainment: USA remained a top-five cable entertainment network during the second quarter among key demographics, extending a leadership position that spans more than three decades. Live sports continued to attract large, highly engaged audiences, with the WNBA's inaugural season on USA delivering the three most-watched games across cable and streaming during the quarter, while League One Volleyball increased viewership over its inaugural season. The Company also announced a five-year agreement with the Bundesliga to broadcast more than 300 live matches annually, with at least 30 premium matches airing on USA Network and all other matches streaming for free on Fandango. In entertainment, Everything on the Menu delivered double-digit ratings growth in its second season. Versant also continued investing in new originals, including Anna Pigeon and The Golden Life, set to premiere this month and in the fall, respectively.
Platforms: Fandango launched its new ad-supported streaming service, bringing together ticketing, home entertainment and free streaming under the Fandango brand, while healthy ticketing volume drove strong performance in the quarter. GolfNow delivered broad-based growth across rounds booked, global course relationships, payments volume and GolfPass subscribers. The Company is further expanding its golf ecosystem with the acquisition of Full Swing and continues to advance its direct-to-consumer offerings at CNBC and MS NOW.
Second Quarter 2026 Financial Results
| Three Months Ended June 30, | |||||||||||||||||
| 2026 | 2025 | Change | |||||||||||||||
(in millions) | |||||||||||||||||
| Revenue: | |||||||||||||||||
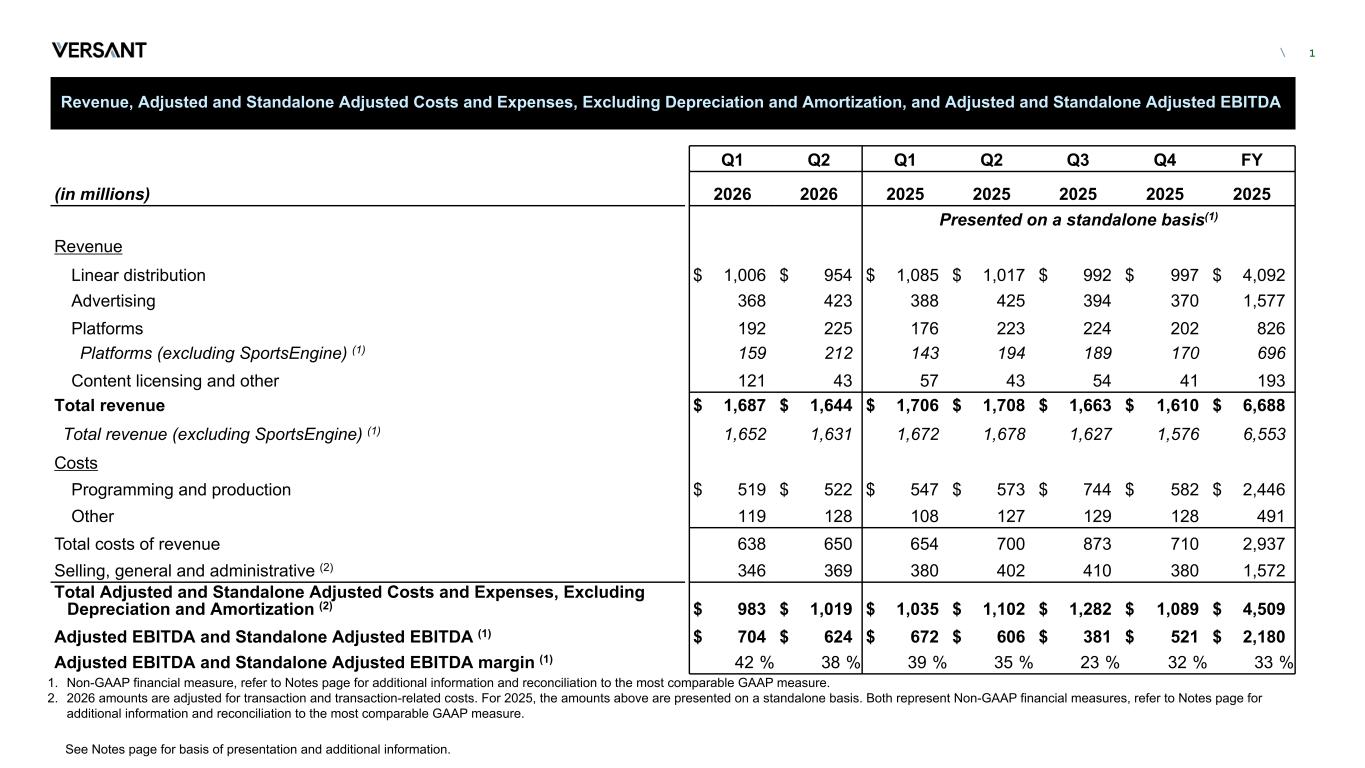
| Linear distribution | $ | 954 | $ | 1,017 | (6.3) | % | |||||||||||
| Advertising | 423 | 425 | (0.6) | % | |||||||||||||
| Platforms | 225 | 223 | 0.8 | % | |||||||||||||
Platforms (excluding SportsEngine)1 | 212 | 194 | 9.3 | % | |||||||||||||
| Content licensing and other | 43 | 43 | (0.6) | % | |||||||||||||
| Total revenue | $ | 1,644 | $ | 1,708 | (3.8) | % | |||||||||||
Total revenue (excluding SportsEngine)1 | $ | 1,631 | $ | 1,678 | (2.8) | % | |||||||||||
Net income attributable to Versant | $ | 211 | $ | 302 | (30.1) | % | |||||||||||
Adjusted EBITDA2 | $ | 624 | $ | 685 | (8.9) | % | |||||||||||
Standalone Adjusted EBITDA2 | $ | 606 | 3.0 | % | |||||||||||||
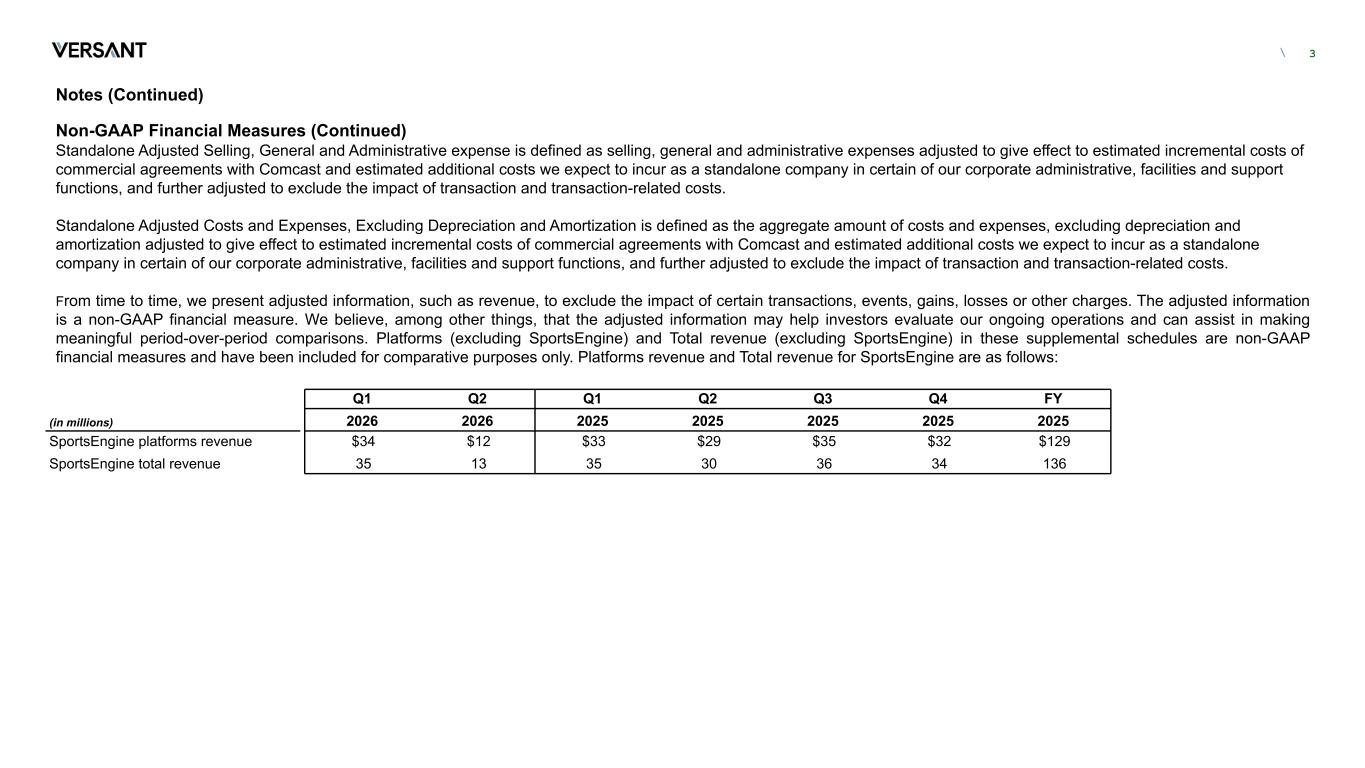
1 Platforms (excluding SportsEngine) and Total revenue (excluding SportsEngine) are non-GAAP financial measures and have been included for comparative purposes only. Platforms revenue related to SportsEngine totaled $12 million and $29 million, respectively, for the three months ended June 30, 2026 and 2025. Total revenue related to SportsEngine totaled $13 million and $30 million, respectively, for the three months ended June 30, 2026 and 2025. We believe, among other things, these measures may help investors evaluate our ongoing operations and can assist in making meaningful period-over-period comparisons given that the divestiture of SportsEngine was completed during the second quarter of 2026.
2 Adjusted EBITDA and Standalone Adjusted EBITDA are non-GAAP financial measures. Standalone Adjusted EBITDA and growth rate compared to Adjusted EBITDA have been included for comparative purposes only. Further information and reconciliations to the most comparable GAAP measures can be found under Table 4 below.
Total Revenue of $1,644 million representing a decline of 3.8% compared to the same period in 2025. Excluding the impact of SportsEngine, revenue decreased 2.8%.
•Linear Distribution revenue declined 6.3% in the second quarter of 2026 as compared to the same period in 2025, primarily due to subscriber declines, which were partially offset by contractual rate increases.
•Advertising revenue declined 0.6% in the second quarter of 2026 as compared to the same period in 2025, reflecting improvements in recent trends including favorable ratings at the networks, as well as incremental revenue from a recent acquisition.
•Platforms revenue increased 0.8% in the second quarter of 2026 as compared to the same period in 2025, or 9.3% excluding the impact of SportsEngine, due to higher revenue at Fandango and GolfNow. The increased revenue at Fandango primarily related to movie ticket purchases and video-on-demand transactions, as well as sales from our new cinema operating platform. The revenue growth at GolfNow was primarily due to higher bookings, payments and subscription revenue. These increases in revenue were partially offset by the impact of our divestiture of SportsEngine during the second quarter of 2026.
•Content licensing and other revenue remained relatively flat in the second quarter of 2026 as compared to the same period in 2025.
Net income attributable to Versant of $211 million decreased $91 million compared to the prior year quarter, primarily due to lower revenue, public company costs, interest expense following the separation from Comcast, and increased tax expense largely due to the divestiture of SportsEngine.
Adjusted EBITDA2 of $624 million decreased 8.9% compared to the prior year quarter. Compared to Standalone Adjusted EBITDA in the prior year quarter, Adjusted EBITDA increased 3.0%. This increase reflects lower programming expenses and reduced selling, general and administrative costs, which offset revenue declines.
Net cash provided by operating activities was $382 million and Free Cash Flow2 was $350 million in the second quarter of 2026.
2026 Financial Outlook
The Company raised its full-year 2026 outlook for Total Revenue and Adjusted EBITDA and maintained its Free Cash Flow outlook:
•Total Revenue of $6.2 billion to $6.45 billion
•Adjusted EBITDA2 of $1.9 billion to $2.05 billion
•Free Cash Flow2 maintained at $1.0 billion to $1.2 billion
Dividends and Share Repurchase Program
On August 6, 2026, the Board of Directors declared the third quarterly cash dividend of $0.375 per share, payable on October 22, 2026, to shareholders of record as of the close of business on October 1, 2026.
On May 15, 2026, the Company entered into an accelerated share repurchase agreement (“ASR Agreement”) to repurchase $100 million of its Class A common stock under the Company's stock repurchase program. The Company completed the transaction during the second quarter and repurchased 2,374,942 shares of Class A common stock, with a remaining authorization of approximately $800 million as of June 30, 2026.
The Company expects to enter into an ASR Agreement commencing August 7, 2026, to repurchase $100 million of its Class A common stock under the Company's stock repurchase program. The Company anticipates completing the transaction during the third quarter of 2026.
Basis of Presentation
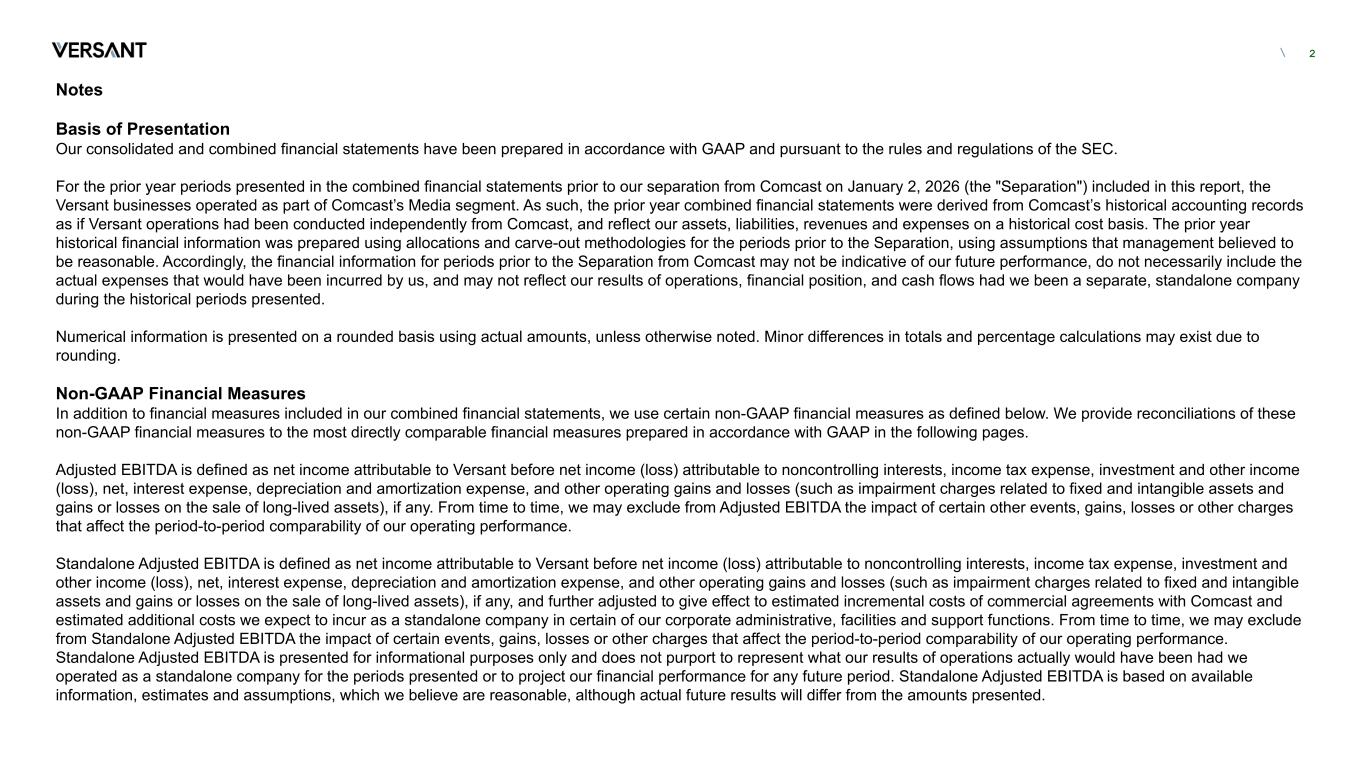
The interim condensed consolidated and combined financial statements have been prepared in accordance with GAAP and pursuant to the rules and regulations of the SEC.
For the prior year periods presented in the combined financial statements prior to our separation from Comcast on January 2, 2026 (the "Separation") included in this report, the Versant businesses operated as part of Comcast’s Media segment. As such, the prior year combined financial statements were derived from Comcast’s historical accounting records as if Versant operations had been conducted independently from Comcast, and reflect our assets, liabilities, revenues and expenses on a historical cost basis. The
2 Adjusted EBITDA and Free Cash Flow are non-GAAP financial measures. Further information and reconciliations to the most comparable GAAP measures, as well as explanations as to why reconciliations are not provided for forward-looking information, can be found under Table 4 below.
prior year historical financial statements were prepared using allocations and carve-out methodologies for the periods prior to the Separation, using assumptions that management believed to be reasonable. Accordingly, the combined financial statements herein for periods prior to the Separation from Comcast may not be indicative of our future performance, do not necessarily include the actual expenses that would have been incurred by us, and may not reflect our results of operations, financial position, and cash flows had we been a separate, standalone company during the historical periods presented.
Numerical information in this report is presented on a rounded basis using actual amounts. Minor differences in totals and percentage calculations may exist due to rounding.
Conference Call and Other Information
The Company will host a conference call on August 6, 2026, at 8:00 a.m. ET. A live webcast of the call and related presentation materials will be available on the Company’s Investor Relations website at www.versantmedia.com/investors. Following the conference call, an audio replay will also be made available on the Investor Relations website.
For additional information about Versant, including SEC filings, please visit the Investor Relations website at www.versantmedia.com/investors or www.versantmedia.com.
| Investor Contacts: | |||||
| Wylie Collins | Wylie.Collins@VersantMedia.com | ||||
| Natalie Candela | Natalie.Candela@VersantMedia.com | ||||
| Press Contacts: | |||||
| Keith Cocozza | Keith@VersantMedia.com | ||||
| Hollie Tracz | Hollie.Tracz@VersantMedia.com | ||||
Caution Concerning Forward-Looking Statements
This press release includes statements that may constitute forward-looking statements within the meaning of the Private Securities Litigation Reform Act of 1995, Section 27A of the Securities Act of 1933, and Section 21E of the Securities Exchange Act of 1934. In some cases, you can identify these statements by forward-looking words such as “may,” “might,” “would,” “will,” “should,” “could,” “expects,” “plans,” “intends,” “anticipates,” “believes,” “estimates,” “predicts,” “potential,” “opportunity,” “strategy,” “future,” “goal,” "outlook," “commit,” or “continue,” the negative of these terms and other comparable terminology. These statements are only predictions based on our current expectations and projections about future events and reflect our beliefs regarding such future events and do not represent historical facts or statements of current condition. In evaluating these statements, readers should consider various factors, including the risks and uncertainties we describe in the “Risk Factors” sections of our most recent Annual Report on Form 10-K, and other reports filed with the Securities and Exchange Commission (SEC). Factors that could cause our actual results to differ materially from these forward-looking statements include changes in and/or risks associated with: the ability to deliver benefits of acquisitions and divestitures; the competitive environment; consumer behavior; distribution agreements; the advertising market; our brands and reputation; consumer acceptance of our content; growth of our digital platforms; use and protection of our intellectual property; cyber-attacks or incidents, information or security breaches or technology disruptions; weak economic conditions; personnel; labor disputes; laws and regulations; network rebrands; adverse decisions in litigation or governmental investigations; investments and acquisitions; our separation from Comcast Corporation; obligations associated with being a public company; our indebtedness; and other risks described from time to time in reports and other documents we file with the SEC. Readers are cautioned not to place undue reliance on forward-looking statements, which speak only as of the date they are made, and involve risks and uncertainties that could cause actual events or our actual results to differ materially from those expressed in any such forward-looking statements. We undertake no obligation to update or revise publicly any forward-looking statements, whether because of new information, future events or otherwise. The amount and timing of any dividends and share repurchases are subject to business, economic and other relevant factors.
About Versant Media Group, Inc.
Versant Media Group, Inc. (Nasdaq: VSNT) is an industry-changing media and entertainment business and home to trusted brands that shape culture, inform audiences, and build lasting connections. It operates in four core markets: political news and opinion; business news and personal finance; golf; and sports and genre entertainment. These markets are served through a powerful portfolio of iconic and innovative brands, including MS NOW, CNBC, USA Network, Golf Channel, E!, SYFY and Oxygen, and complementary digital platforms Fandango, Rotten Tomatoes, GolfNow and GolfPass. Visit www.versantmedia.com for more information.
| TABLE 1 Condensed Consolidated and Combined Statements of Income (Unaudited) | |||||||||||||||||||||||
| Three Months Ended June 30, | Six Months Ended June 30, | ||||||||||||||||||||||
| 2026 | 2025 | 2026 | 2025 | ||||||||||||||||||||
| (in millions, except per share data) | |||||||||||||||||||||||
| Revenue | $ | 1,644 | $ | 1,708 | $ | 3,331 | $ | 3,415 | |||||||||||||||
| Costs and expenses | |||||||||||||||||||||||
| Costs of revenue (exclusive of depreciation and amortization) | 650 | 700 | 1,288 | 1,354 | |||||||||||||||||||
| Selling, general and administrative | 369 | 355 | 720 | 662 | |||||||||||||||||||
| Depreciation and amortization | 258 | 244 | 514 | 489 | |||||||||||||||||||
| Total costs and expenses | 1,277 | 1,298 | 2,522 | 2,505 | |||||||||||||||||||
| Operating income | 367 | 410 | 809 | 910 | |||||||||||||||||||
| Interest expense | (52) | — | (105) | — | |||||||||||||||||||
| Investment and other income (loss), net | 9 | (1) | 16 | (1) | |||||||||||||||||||
| Income before income taxes | 323 | 409 | 721 | 908 | |||||||||||||||||||
Income tax expense | (112) | (106) | (224) | (238) | |||||||||||||||||||
| Net income | 211 | 303 | 497 | 670 | |||||||||||||||||||
Less: Net income attributable to noncontrolling interests | — | 1 | — | 1 | |||||||||||||||||||
| Net income attributable to Versant | $ | 211 | $ | 302 | $ | 497 | $ | 669 | |||||||||||||||
| Basic earnings per common share attributable to Versant shareholders | $ | 1.50 | $ | 2.09 | $ | 3.49 | $ | 4.64 | |||||||||||||||
| Diluted earnings per common share attributable to Versant shareholders | $ | 1.49 | $ | 2.09 | $ | 3.49 | $ | 4.64 | |||||||||||||||
| TABLE 2 Condensed Consolidated and Combined Statements of Cash Flows (Unaudited) | |||||||||||
| Six Months Ended June 30, | |||||||||||
| 2026 | 2025 | ||||||||||
| (in millions) | |||||||||||
| Operating Activities | |||||||||||
| Net income | $ | 497 | $ | 670 | |||||||
Adjustments to reconcile net income to net cash provided by operating activities: | |||||||||||
| Depreciation and amortization | 514 | 489 | |||||||||
Share-based compensation | 33 | 14 | |||||||||
| Noncash interest expense | 5 | — | |||||||||
| Net loss on investment activity and other | 2 | 2 | |||||||||
| Deferred income taxes | (110) | (67) | |||||||||
Changes in operating assets and liabilities: | |||||||||||
| Current and noncurrent receivables, net | (523) | (22) | |||||||||
Content costs, net | 68 | 64 | |||||||||
| Accounts payable | 105 | (13) | |||||||||
| Other operating assets and liabilities | 376 | (24) | |||||||||
| Net cash provided by operating activities | 967 | 1,113 | |||||||||
| Investing Activities | |||||||||||
| Capital expenditures | (59) | (63) | |||||||||
| Acquisitions of businesses and investments | (199) | — | |||||||||
| Proceeds from sale of business | 140 | — | |||||||||
| Other | — | (14) | |||||||||
Net cash used in investing activities | (119) | (77) | |||||||||
| Financing Activities | |||||||||||
| Proceeds from borrowings | 1,973 | — | |||||||||
| Repurchases of common stock under repurchase program and employee plans | (200) | — | |||||||||
| Dividends paid | (53) | — | |||||||||
Net transfers to Comcast | (2,250) | (1,028) | |||||||||
| Settlement payment from NBCUniversal | 70 | — | |||||||||
| Other | (2) | (12) | |||||||||
Net cash used in financing activities | (462) | (1,040) | |||||||||
Increase (decrease) in cash, cash equivalents and restricted cash | 386 | (4) | |||||||||
Cash and cash equivalents and restricted cash, beginning of year | 1,092 | 8 | |||||||||
| Cash and cash equivalents, end of period | $ | 1,478 | $ | 4 | |||||||
| TABLE 3 Condensed Consolidated and Combined Balance Sheets (Unaudited) | |||||||||||
| June 30, | December 31, | ||||||||||
| 2026 | 2025 | ||||||||||
| (in millions) | |||||||||||
| Assets | |||||||||||
| Current Assets: | |||||||||||
| Cash and cash equivalents | $ | 1,478 | $ | 55 | |||||||
| Restricted cash | — | 1,034 | |||||||||
| Receivables, net | 1,326 | 1,151 | |||||||||
| Assets held for sale | — | 196 | |||||||||
| Other current assets | 133 | 66 | |||||||||
| Total current assets | 2,937 | 2,502 | |||||||||
Content costs | 587 | 539 | |||||||||
| Investments | 248 | 214 | |||||||||
Property and equipment, net of accumulated depreciation of $632 million and $615 million | 441 | 423 | |||||||||
Intangible assets, net of accumulated amortization of $9,163 million and $8,848 million | 499 | 924 | |||||||||
| Goodwill | 7,804 | 7,611 | |||||||||
| Other noncurrent assets, net | 224 | 120 | |||||||||
Total assets | $ | 12,740 | $ | 12,333 | |||||||
| Liabilities and Equity | |||||||||||
| Current Liabilities: | |||||||||||
| Accounts payable | $ | 268 | $ | 151 | |||||||
| Deferred revenue | 83 | 163 | |||||||||
Accrued content obligations | 245 | 105 | |||||||||
Accrued employee costs | 100 | 62 | |||||||||
| Current portion of long-term debt | 113 | — | |||||||||
| Accrued expenses and other current liabilities | 425 | 141 | |||||||||
| Total current liabilities | 1,234 | 622 | |||||||||
| Deferred income taxes | 110 | 191 | |||||||||
Noncurrent content obligations | 68 | 72 | |||||||||
| Long-term debt | 2,841 | 983 | |||||||||
| Other noncurrent liabilities | 263 | 63 | |||||||||
| Commitments and contingencies | |||||||||||
| Equity: | |||||||||||
Preferred stock, no par value — authorized 20 million shares; none issued as of June 30, 2026 | — | — | |||||||||
Class A common stock, $0.01 par value — authorized 7.5 billion shares; issued and outstanding 138,773,682 shares as of June 30, 2026 | 1 | — | |||||||||
Class B common stock, $0.01 par value — authorized 75 million shares; issued and outstanding 377,775 shares as of June 30, 2026 | — | — | |||||||||
| Additional paid-in capital | 7,723 | — | |||||||||
| Retained earnings | 388 | — | |||||||||
| Net Comcast investment | — | 10,299 | |||||||||
| Accumulated other comprehensive income (loss) | 1 | (7) | |||||||||
| Total equity attributable to Versant | 8,114 | 10,292 | |||||||||
| Noncontrolling interests | 111 | 110 | |||||||||
| Total equity | 8,224 | 10,402 | |||||||||
Total liabilities and equity | $ | 12,740 | $ | 12,333 | |||||||
| TABLE 4 Supplemental Disclosures Regarding Non-GAAP Financial Measures | |||||||||||
Adjusted EBITDA
Adjusted EBITDA is a non-GAAP financial measure and is a key measure used to assess the operational strength and performance of our business as well as to assist in the evaluation of underlying trends in our business. This measure eliminates the significant level of noncash depreciation and amortization expense that results from property and equipment and intangible assets recognized in business combinations. It is also unaffected by our capital and tax structures, and by our investment activities, including the impacts of entities that we do not consolidate, as our management excludes these results when evaluating our operating performance. Our management and Board of Directors use this financial measure to evaluate our operating performance and to allocate resources. It is also a significant performance measure in our annual incentive compensation programs. Additionally, we believe that Adjusted EBITDA is useful to investors because it is one of the bases for comparing our operating performance with that of other companies in our industries, although our measure of Adjusted EBITDA may not be directly comparable to similar measures used by other companies.
We define Adjusted EBITDA as net income attributable to Versant before net income (loss) attributable to noncontrolling interests, income tax expense, investment and other income (loss), net, interest expense, depreciation and amortization expense, and other operating gains and losses (such as impairment charges related to fixed and intangible assets and gains or losses on the sale of long-lived assets), if any. From time to time, we may exclude from Adjusted EBITDA the impact of certain other events, gains, losses or other charges that affect the period-to-period comparability of our operating performance. Reconciliations of Adjusted EBITDA to the nearest GAAP measures for historical periods are presented below. A reconciliation for full-year 2026 outlook cannot be provided without unreasonable efforts because of the inherent difficulty in forecasting certain amounts that are necessary for such reconciliations due to the uncertainty and potential variability of reconciling items, which are dependent on future events and often outside of management’s control and which could be significant. Forward-looking estimates are made in a manner consistent with the relevant definitions noted herein.
Standalone Adjusted EBITDA
Standalone Adjusted EBITDA is a non-GAAP financial measure used in periods prior to the Separation to measure the operational strength and performance of our business as well as to assist in the evaluation of underlying trends in our business. Consistent with Adjusted EBITDA, this measure eliminates noncash depreciation and amortization expense and is unaffected by our capital and tax structures and by our investment activities, as our management excludes these results when evaluating our operating performance. Standalone Adjusted EBITDA also includes estimated incremental costs of operating as a standalone company following the Separation. We use Standalone Adjusted EBITDA and believe this measure is useful to investors because it provides an estimate of our operating performance giving effect to the Separation and related transactions and additional costs that we expect to incur as a standalone company for the periods presented, and is one of the bases for comparing our operating performance with that of other companies in our industries, although our measure of Standalone Adjusted EBITDA may not be directly comparable to similar measures used by other companies.
We define Standalone Adjusted EBITDA as net income attributable to Versant before net income (loss) attributable to noncontrolling interests, income tax expense, investment and other income (loss), net, interest expense, depreciation and amortization expense, and other operating gains and losses (such as impairment charges related to fixed and intangible assets and gains or losses on the sale of long-lived assets), if any, and further adjusted to give effect to estimated incremental costs of commercial agreements with Comcast and estimated additional costs we expect to incur as a standalone company in certain of our corporate administrative, facilities and support functions. From time to time, we may exclude from Standalone Adjusted EBITDA the impact of certain events, gains, losses or other charges that affect the period-to-period comparability of our operating performance. Standalone Adjusted EBITDA is presented for informational purposes only and does not purport to represent what our results of operations actually would have been had we operated as a standalone company for the periods presented or to project our financial performance for any future period. Standalone Adjusted EBITDA is based on available information, estimates and assumptions, which we believe are reasonable, although actual future results will differ from the amounts presented.
Reconciliations of Adjusted EBITDA to the nearest GAAP measures for historical periods are presented below.
| Reconciliation from Net Income Attributable to Versant to Adjusted EBITDA and Standalone Adjusted EBITDA (Unaudited) | |||||||||||||||||||||||
| Three Months Ended June 30, | Six Months Ended June 30, | ||||||||||||||||||||||
| 2026 | 2025 | 2026 | 2025 | ||||||||||||||||||||
| (in millions) | |||||||||||||||||||||||
| Net income attributable to Versant | $ | 211 | $ | 302 | $ | 497 | $ | 669 | |||||||||||||||
Net income attributable to noncontrolling interests | — | 1 | — | 1 | |||||||||||||||||||
| Income tax expense | 112 | 106 | 224 | 238 | |||||||||||||||||||
| Investment and other (income) loss, net | (9) | 1 | (16) | 1 | |||||||||||||||||||
| Interest expense | 52 | — | 105 | — | |||||||||||||||||||
| Depreciation and amortization | 258 | 244 | 514 | 489 | |||||||||||||||||||
Adjustments for transaction and transaction-related costs (1) | — | 32 | 5 | 44 | |||||||||||||||||||
| Adjusted EBITDA | $ | 624 | $ | 685 | $ | 1,328 | $ | 1,442 | |||||||||||||||
Incremental costs of commercial agreements with Comcast (2) | (43) | (88) | |||||||||||||||||||||
Incremental costs of corporate administrative, facilities and support functions (3) | (36) | (76) | |||||||||||||||||||||
| Standalone Adjusted EBITDA | $ | 606 | $ | 1,278 | |||||||||||||||||||
________________________________________________________________
(1)Transaction costs are incremental costs directly related to effectuating the Separation and primarily include legal, audit and advisory fees. Transaction-related costs are incremental costs incurred in anticipation of the Separation and primarily include IT separation and implementation costs, advisory fees and other one-time costs.
| Three Months Ended June 30, | Six Months Ended June 30, | ||||||||||||||||||||||
| 2026 | 2025 | 2026 | 2025 | ||||||||||||||||||||
| (in millions) | |||||||||||||||||||||||
| Transaction costs | $ | — | $ | 16 | $ | 2 | $ | 27 | |||||||||||||||
| Transaction-related costs | — | 16 | 3 | 17 | |||||||||||||||||||
| Total transaction and transaction-related costs | $ | — | $ | 32 | $ | 5 | $ | 44 | |||||||||||||||
(2)Amounts represent incremental costs of commercial agreements entered into with Comcast in connection with the Separation and primarily relate to the commercial services agreement for the sale and use of our advertising and promotional inventory.
(3)Amounts represent estimated incremental costs related to corporate administrative, facilities and support functions and primarily include the recurring and ongoing costs required to operate new functions required for a public company such as external reporting, internal audit, treasury, investor relations, board of directors and stock administration, and expanding the services of existing functions such as information technology, finance, supply chain, human resources, legal, tax, facilities and insurance. Amounts were determined by comparing expected costs to amounts in the combined statements of income, inclusive of allocation for centralized functions within Comcast and allocations of costs for the use of shared assets.
Free Cash Flow
Free Cash Flow is a non-GAAP financial measure that we believe provides a meaningful measure of liquidity and a useful basis for assessing our ability to repay debt, make strategic acquisitions and investments, and return capital to investors through stock repurchases and dividends. It is also a significant performance measure in our annual incentive compensation programs. Additionally, we believe Free Cash Flow is useful to investors as a basis for comparing our performance and coverage ratios with other companies in our industries, although our measure of Free Cash Flow may not be directly comparable to similar measures used by other companies. Free Cash Flow has certain limitations, including that it does not represent the residual cash flow available for discretionary expenditures since other non-discretionary payments, such as mandatory debt repayments, are not deducted from the measure.
Free Cash Flow is defined as net cash provided by operating activities, reduced by capital expenditures. From time to time, we may exclude from Free Cash Flow the impact of certain cash receipts or payments that affect comparability. Reconciliations of Free Cash Flow to the nearest GAAP measures for historical periods are presented below. A reconciliation for full-year 2026 outlook cannot be provided without unreasonable efforts because of the inherent difficulty in forecasting certain amounts that are necessary for such reconciliations due to the uncertainty and potential variability of reconciling items, which are dependent on future events and often outside of management’s control and which could be significant. Forward-looking estimates are made in a manner consistent with the relevant definitions noted herein.
| Three Months Ended June 30, | Six Months Ended June 30, | ||||||||||
| 2026 | 2026 | ||||||||||
| (in millions) | |||||||||||
Net cash provided by operating activities | $ | 382 | $ | 967 | |||||||
| Capital expenditures | (32) | (59) | |||||||||
| Free Cash Flow | $ | 350 | $ | 908 | |||||||
\ Supplemental Financial Information August 6, 2026
\ Revenue, Adjusted and Standalone Adjusted Costs and Expenses, Excluding Depreciation and Amortization, and Adjusted and Standalone Adjusted EBITDA Q1 Q2 Q1 Q2 Q3 Q4 FY (in millions) 2026 2026 2025 2025 2025 2025 2025 Presented on a standalone basis(1) Revenue Linear distribution $ 1,006 $ 954 $ 1,085 $ 1,017 $ 992 $ 997 $ 4,092 Advertising 368 423 388 425 394 370 1,577 Platforms 192 225 176 223 224 202 826 Platforms (excluding SportsEngine) (1) 159 212 143 194 189 170 696 Content licensing and other 121 43 57 43 54 41 193 Total revenue $ 1,687 $ 1,644 $ 1,706 $ 1,708 $ 1,663 $ 1,610 $ 6,688 Total revenue (excluding SportsEngine) (1) 1,652 1,631 1,672 1,678 1,627 1,576 6,553 Costs Programming and production $ 519 $ 522 $ 547 $ 573 $ 744 $ 582 $ 2,446 Other 119 128 108 127 129 128 491 Total costs of revenue 638 650 654 700 873 710 2,937 Selling, general and administrative (2) 346 369 380 402 410 380 1,572 Total Adjusted and Standalone Adjusted Costs and Expenses, Excluding Depreciation and Amortization (2) $ 983 $ 1,019 $ 1,035 $ 1,102 $ 1,282 $ 1,089 $ 4,509 Adjusted EBITDA and Standalone Adjusted EBITDA (1) $ 704 $ 624 $ 672 $ 606 $ 381 $ 521 $ 2,180 Adjusted EBITDA and Standalone Adjusted EBITDA margin (1) 42 % 38 % 39 % 35 % 23 % 32 % 33 % 1 1. Non-GAAP financial measure, refer to Notes page for additional information and reconciliation to the most comparable GAAP measure. 2. 2026 amounts are adjusted for transaction and transaction-related costs. For 2025, the amounts above are presented on a standalone basis. Both represent Non-GAAP financial measures, refer to Notes page for additional information and reconciliation to the most comparable GAAP measure. See Notes page for basis of presentation and additional information.
\ Notes Basis of Presentation Our consolidated and combined financial statements have been prepared in accordance with GAAP and pursuant to the rules and regulations of the SEC. For the prior year periods presented in the combined financial statements prior to our separation from Comcast on January 2, 2026 (the "Separation") included in this report, the Versant businesses operated as part of Comcast’s Media segment. As such, the prior year combined financial statements were derived from Comcast’s historical accounting records as if Versant operations had been conducted independently from Comcast, and reflect our assets, liabilities, revenues and expenses on a historical cost basis. The prior year historical financial information was prepared using allocations and carve-out methodologies for the periods prior to the Separation, using assumptions that management believed to be reasonable. Accordingly, the financial information for periods prior to the Separation from Comcast may not be indicative of our future performance, do not necessarily include the actual expenses that would have been incurred by us, and may not reflect our results of operations, financial position, and cash flows had we been a separate, standalone company during the historical periods presented. Numerical information is presented on a rounded basis using actual amounts, unless otherwise noted. Minor differences in totals and percentage calculations may exist due to rounding. Non-GAAP Financial Measures In addition to financial measures included in our combined financial statements, we use certain non-GAAP financial measures as defined below. We provide reconciliations of these non-GAAP financial measures to the most directly comparable financial measures prepared in accordance with GAAP in the following pages. Adjusted EBITDA is defined as net income attributable to Versant before net income (loss) attributable to noncontrolling interests, income tax expense, investment and other income (loss), net, interest expense, depreciation and amortization expense, and other operating gains and losses (such as impairment charges related to fixed and intangible assets and gains or losses on the sale of long-lived assets), if any. From time to time, we may exclude from Adjusted EBITDA the impact of certain other events, gains, losses or other charges that affect the period-to-period comparability of our operating performance. Standalone Adjusted EBITDA is defined as net income attributable to Versant before net income (loss) attributable to noncontrolling interests, income tax expense, investment and other income (loss), net, interest expense, depreciation and amortization expense, and other operating gains and losses (such as impairment charges related to fixed and intangible assets and gains or losses on the sale of long-lived assets), if any, and further adjusted to give effect to estimated incremental costs of commercial agreements with Comcast and estimated additional costs we expect to incur as a standalone company in certain of our corporate administrative, facilities and support functions. From time to time, we may exclude from Standalone Adjusted EBITDA the impact of certain events, gains, losses or other charges that affect the period-to-period comparability of our operating performance. Standalone Adjusted EBITDA is presented for informational purposes only and does not purport to represent what our results of operations actually would have been had we operated as a standalone company for the periods presented or to project our financial performance for any future period. Standalone Adjusted EBITDA is based on available information, estimates and assumptions, which we believe are reasonable, although actual future results will differ from the amounts presented. 2
\ Notes (Continued) Non-GAAP Financial Measures (Continued) Standalone Adjusted Selling, General and Administrative expense is defined as selling, general and administrative expenses adjusted to give effect to estimated incremental costs of commercial agreements with Comcast and estimated additional costs we expect to incur as a standalone company in certain of our corporate administrative, facilities and support functions, and further adjusted to exclude the impact of transaction and transaction-related costs. Standalone Adjusted Costs and Expenses, Excluding Depreciation and Amortization is defined as the aggregate amount of costs and expenses, excluding depreciation and amortization adjusted to give effect to estimated incremental costs of commercial agreements with Comcast and estimated additional costs we expect to incur as a standalone company in certain of our corporate administrative, facilities and support functions, and further adjusted to exclude the impact of transaction and transaction-related costs. From time to time, we present adjusted information, such as revenue, to exclude the impact of certain transactions, events, gains, losses or other charges. The adjusted information is a non-GAAP financial measure. We believe, among other things, that the adjusted information may help investors evaluate our ongoing operations and can assist in making meaningful period-over-period comparisons. Platforms (excluding SportsEngine) and Total revenue (excluding SportsEngine) in these supplemental schedules are non-GAAP financial measures and have been included for comparative purposes only. Platforms revenue and Total revenue for SportsEngine are as follows: 3 Q1 Q2 Q1 Q2 Q3 Q4 FY (in millions) 2026 2026 2025 2025 2025 2025 2025 SportsEngine platforms revenue $34 $12 $33 $29 $35 $32 $129 SportsEngine total revenue 35 13 35 30 36 34 136
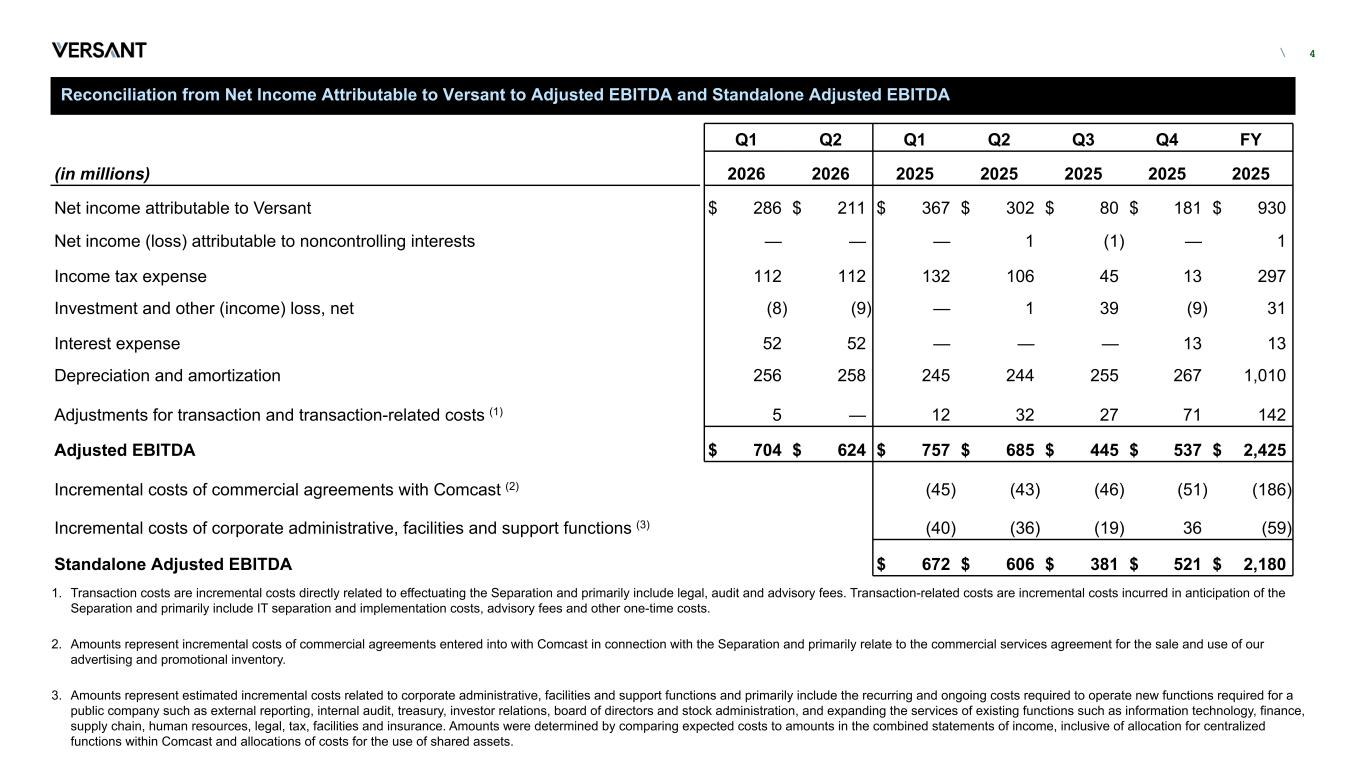
\ Reconciliation from Net Income Attributable to Versant to Adjusted EBITDA and Standalone Adjusted EBITDA Q1 Q2 Q1 Q2 Q3 Q4 FY (in millions) 2026 2026 2025 2025 2025 2025 2025 Net income attributable to Versant $ 286 $ 211 $ 367 $ 302 $ 80 $ 181 $ 930 Net income (loss) attributable to noncontrolling interests — — — 1 (1) — 1 Income tax expense 112 112 132 106 45 13 297 Investment and other (income) loss, net (8) (9) — 1 39 (9) 31 Interest expense 52 52 — — — 13 13 Depreciation and amortization 256 258 245 244 255 267 1,010 Adjustments for transaction and transaction-related costs (1) 5 — 12 32 27 71 142 Adjusted EBITDA $ 704 $ 624 $ 757 $ 685 $ 445 $ 537 $ 2,425 Incremental costs of commercial agreements with Comcast (2) (45) (43) (46) (51) (186) Incremental costs of corporate administrative, facilities and support functions (3) (40) (36) (19) 36 (59) Standalone Adjusted EBITDA $ 672 $ 606 $ 381 $ 521 $ 2,180 4 1. Transaction costs are incremental costs directly related to effectuating the Separation and primarily include legal, audit and advisory fees. Transaction-related costs are incremental costs incurred in anticipation of the Separation and primarily include IT separation and implementation costs, advisory fees and other one-time costs. 2. Amounts represent incremental costs of commercial agreements entered into with Comcast in connection with the Separation and primarily relate to the commercial services agreement for the sale and use of our advertising and promotional inventory. 3. Amounts represent estimated incremental costs related to corporate administrative, facilities and support functions and primarily include the recurring and ongoing costs required to operate new functions required for a public company such as external reporting, internal audit, treasury, investor relations, board of directors and stock administration, and expanding the services of existing functions such as information technology, finance, supply chain, human resources, legal, tax, facilities and insurance. Amounts were determined by comparing expected costs to amounts in the combined statements of income, inclusive of allocation for centralized functions within Comcast and allocations of costs for the use of shared assets.
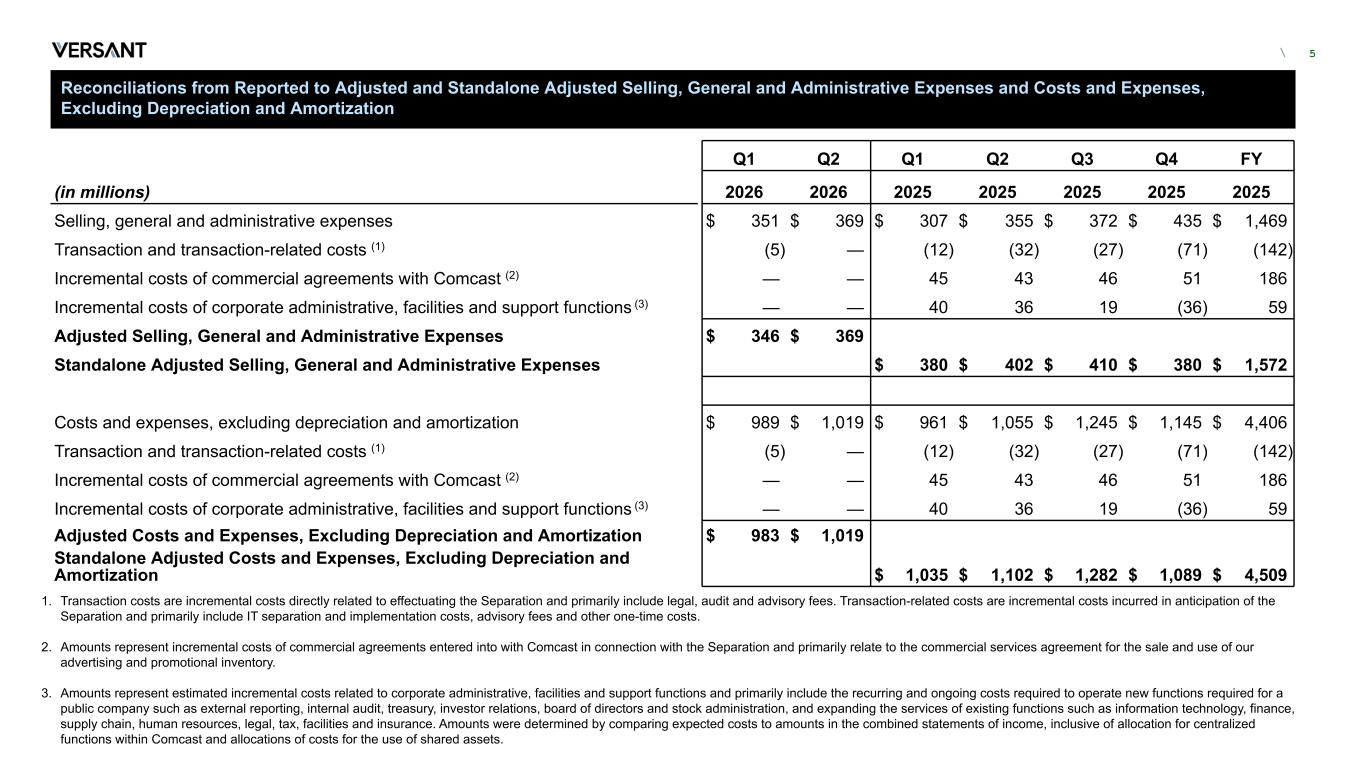
\ Reconciliations from Reported to Adjusted and Standalone Adjusted Selling, General and Administrative Expenses and Costs and Expenses, Excluding Depreciation and Amortization Q1 Q2 Q1 Q2 Q3 Q4 FY (in millions) 2026 2026 2025 2025 2025 2025 2025 Selling, general and administrative expenses $ 351 $ 369 $ 307 $ 355 $ 372 $ 435 $ 1,469 Transaction and transaction-related costs (1) (5) — (12) (32) (27) (71) (142) Incremental costs of commercial agreements with Comcast (2) — — 45 43 46 51 186 Incremental costs of corporate administrative, facilities and support functions (3) — — 40 36 19 (36) 59 Adjusted Selling, General and Administrative Expenses $ 346 $ 369 Standalone Adjusted Selling, General and Administrative Expenses $ 380 $ 402 $ 410 $ 380 $ 1,572 Costs and expenses, excluding depreciation and amortization $ 989 $ 1,019 $ 961 $ 1,055 $ 1,245 $ 1,145 $ 4,406 Transaction and transaction-related costs (1) (5) — (12) (32) (27) (71) (142) Incremental costs of commercial agreements with Comcast (2) — — 45 43 46 51 186 Incremental costs of corporate administrative, facilities and support functions (3) — — 40 36 19 (36) 59 Adjusted Costs and Expenses, Excluding Depreciation and Amortization $ 983 $ 1,019 Standalone Adjusted Costs and Expenses, Excluding Depreciation and Amortization $ 1,035 $ 1,102 $ 1,282 $ 1,089 $ 4,509 5 1. Transaction costs are incremental costs directly related to effectuating the Separation and primarily include legal, audit and advisory fees. Transaction-related costs are incremental costs incurred in anticipation of the Separation and primarily include IT separation and implementation costs, advisory fees and other one-time costs. 2. Amounts represent incremental costs of commercial agreements entered into with Comcast in connection with the Separation and primarily relate to the commercial services agreement for the sale and use of our advertising and promotional inventory. 3. Amounts represent estimated incremental costs related to corporate administrative, facilities and support functions and primarily include the recurring and ongoing costs required to operate new functions required for a public company such as external reporting, internal audit, treasury, investor relations, board of directors and stock administration, and expanding the services of existing functions such as information technology, finance, supply chain, human resources, legal, tax, facilities and insurance. Amounts were determined by comparing expected costs to amounts in the combined statements of income, inclusive of allocation for centralized functions within Comcast and allocations of costs for the use of shared assets.